Introduction to Option Chain & Open Interest (OI)
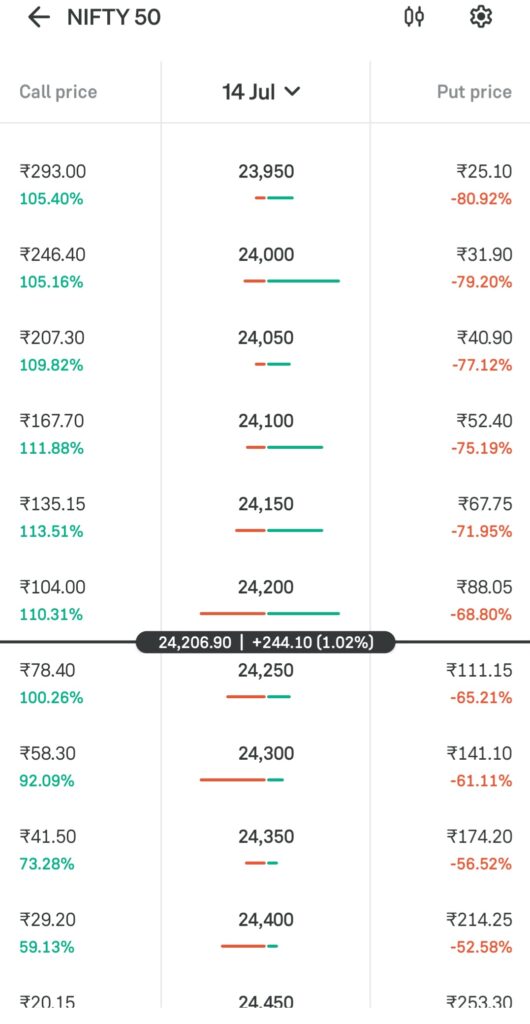
An Option Chain is a complete list of all available options contracts for a specific stock or index (like Nifty). Aap live data dekhne ke liye NSE Official Website check kar sakte hain.
It shows live data for both Call Options (Buyers expecting market to go up) and Put Options (Buyers expecting market to go down).
To read the market direction like a pro, we look at Open Interest (OI). Open Interest represents the total number of outstanding or open options contracts that have not been settled. By analyzing OI data, we can identify strong market support, resistance, and potential big moves.
Key Components to Understand:
- Calls (Bullish View for Buyers / Bearish View for Sellers): Contracts used to trade on the upside.
- Puts (Bearish View for Buyers / Bullish View for Sellers): Contracts used to trade on the downside.
- OI (Open Interest): Shows where the big players (Option Writers) are building their heavy positions.
Market Psychology: Thinking Like an Option Writer (Seller)
To trade successfully using Open Interest (OI) data, you must change your mindset. Most retail traders are Option Buyers, but the smart money and big institutional players are Option Sellers (Writers). Option Selling requires huge capital, which means the big players are risking massive amounts of money. Option Chain ke sath-sath market ka trend samajhne ke liye aapko Candlestick Patterns ko bhi seekhna chahiye., we always analyze OI data from the Option Seller’s perspective.
1. Option Chain: Finding Strong Resistance (High Call OI)
- When big players sell (write) Call options in huge volumes, they believe the market will not go above that specific strike price.
- Therefore, the strike price with the highest Call OI acts as a strong Resistance level.
2.Option Chain: Finding Strong Support (High Put OI)
- When big players sell (write) Put options in huge volumes, they believe the market will not fall below that specific strike price.
- Therefore, the strike price with the highest Put OI acts as a strong Support level.
What is Put-Call Ratio (PCR) & How to Use It?
The Put-Call Ratio (PCR) is a very popular indicator used by traders to identify the overall mood of the market (whether it is Overbought or Oversold). It is calculated by dividing the total Open Interest of Puts by the total Open Interest of Calls on a specific day.
The PCR Formula:
PCR = Total Put OI / Total Call OI
How to Interpret PCR Levels (Golden Rules):
- PCR > 1.3 (Bearish Reversal / Overbought): When the PCR is very high, it means too many puts have been written. The market is now in an Overbought zone, and a sharp downward reversal or profit-booking can happen anytime.
- PCR between 0.9 and 1.1 (Sideways / Neutral): The market is balanced. There is a tough fight between Call writers and Put writers, leading to a range-bound or sideways market.
- PCR < 0.7 (Bullish Reversal / Oversold): When the PCR drops significantly, it means aggressive Call writing has happened. The market is now Oversold, and a strong short-covering rally or upward bounce is highly likely from support levels.
How to Find Support & Resistance using Live Option Chain
When trading indices like Nifty, the live option chain acts as a map for market levels. Here is how you can easily find the major Support and Resistance levels for the day:
1. Identifying Major Resistance (The Ceiling)
- Look at the Call side of the Option Chain.
- Find the strike price that has the Highest Open Interest (OI) and Change in OI.
- Since big players are writing Calls here, this specific strike price will act as the strongest Resistance for the day. If the market approaches this level, it is highly likely to face selling pressure or reverse downward.
2. Identifying Major Support (The Floor)
- Look at the Put side of the Option Chain.
- Find the strike price that has the Highest Open Interest (OI) and Change in OI.
- Since big players are writing Puts here, this specific strike price will act as the strongest Support for the day. If the market drops to this level, buyers are likely to step in and push the market back up.
Pro-Trading Tip:
Always track the Change in OI during live market hours (9:15 AM to 3:30 PM). If Call OI is growing faster than Put OI, the market sentiment is turning Bearish. If Put OI is growing faster than Call OI, the market sentiment is turning Bullish.